
ProSiebenSat.1 at a Glance
The ProSiebenSat.1 Group is one of the largest independent media corporations in Europe. Free TV financed by advertising is our core business. With the stations SAT.1, ProSieben, kabel eins, sixx, SAT.1 Gold, and ProSieben MAXX, we are the number one in the German TV advertising market. We have tapped into an attractive new business area with the distribution of our television channels in HD quality. We are also Germany’s leading online video marketer. We operate maxdome, the biggest German video-on-demand portal, and provide users with the best digital entertainment via our multi-channel network Studio71 or the streaming app 7TV. In recent years, we have built a strong e-commerce portfolio, which is now one of our key growth drivers. In addition, our Group has an international program production and distribution network in seven countries. This means ProSiebenSat.1 has a broad revenue and earnings basis.
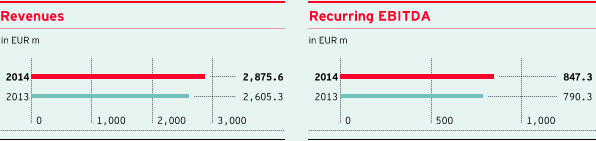
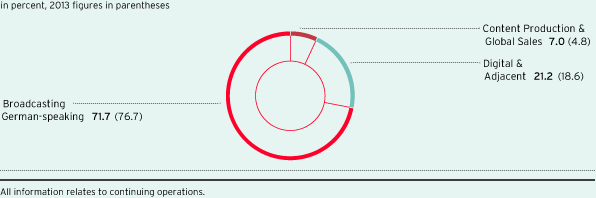
In the 2014 financial year, we generated revenues of EUR 2.876 billion and recurring EBITDA of EUR 847.3 million. By 2018, we want to increase our revenues by a further EUR 1 billion compared to 2012. The growth segment Digital & Adjacent is then expected to contribute 25 % to 30 % of consolidated revenue. These medium-term financial goals are reflected in our strategy: We want to develop the ProSiebenSat.1 Group into a leading Broadcasting, Digital Entertainment and Commerce Powerhouse.

Group revenue share by segment

|
Forecasts 2014 |
Actual figures 2014 |
Forecasts 2015/2016 |
||||||||||||
|
|
|
|
|
|||||||||||
|
||||||||||||||
|
Revenues |
+10.4 % |
Revenues |
Revenues |
|||||||||||
|
Broadcasting German-speaking |
+3.2 % |
Broadcasting German-speaking |
Broadcasting German-speaking |
|||||||||||
|
Digital & Adjacent |
+26.3 % |
Digital & Adjacent |
Digital & Adjacent |
|||||||||||
|
Content Production & Global Sales |
+63.4 % |
Content Production & Global Sales |
Content Production & Global Sales |
|||||||||||
|
Recurring EBITDA |
+7.2 % |
Recurring EBITDA |
Recurring EBITDA |
|||||||||||
|
Broadcasting German-speaking |
+3.6 % |
Broadcasting German-speaking |
Broadcasting German-speaking |
|||||||||||
|
Digital & Adjacent |
+22.7 % |
Digital & Adjacent |
Digital & Adjacent |
|||||||||||
|
Content Production & Global Sales |
+80.1 % |
Content Production & Global Sales |
Content Production & Global Sales |
|||||||||||
|
Underlying net income |
+10.3 % |
Underlying net income |
Underlying net income |
|||||||||||
|
Leverage factor |
1.82 |
Leverage factor |
Leverage factor |
|||||||||||
|
German TV audience market3 |
28.7 % |
German |
German |
|||||||||||
|
Key figures of the ProSiebenSat.1 Group – Part 1 |
||||
|
|
|
|
||
|
in EUR m |
2014 |
2013 |
||
|
Revenues |
2,875.6 |
2,605.3 |
||
|
Revenue margin before income taxes (in %) |
19.5 |
20.2 |
||
|
Total costs |
2,209.0 |
1,961.9 |
||
|
Operating costs1 |
2,046.9 |
1,835.8 |
||
|
Consumption of programming assets |
867.8 |
858.7 |
||
|
Recurring EBITDA2 |
847.3 |
790.3 |
||
|
Recurring EBITDA margin (in %) |
29.5 |
30.3 |
||
|
EBITDA |
818.4 |
757.8 |
||
|
Non-recurring items3 |
–28.9 |
–32.6 |
||
|
EBIT |
694.5 |
668.9 |
||
|
Financial result |
–134.4 |
–142.0 |
||
|
Profit before income taxes |
560.1 |
526.9 |
||
|
Consolidated net profit (after non-controlling interests)4 |
346.3 |
312.1 |
||
|
Profit from discontinued operations (net of income taxes) |
–27.1 |
–47.6 |
||
|
Underlying net income5 |
418.9 |
379.7 |
||
|
Basic earnings per share (underlying) |
1.96 |
1.78 |
||
|
Investments in programming assets |
889.7 |
860.2 |
||
|
Free cash flow |
276.5 |
330.1 |
||
|
Cash flow from investing activities |
–1,148.4 |
–1,018.3 |
||
|
Key figures of the ProSiebenSat.1 Group – Part 2 |
||||||||||||||||||||||||||
|
|
|
|
||||||||||||||||||||||||
|
in EUR m |
12/31/2014 |
12/31/2013 |
||||||||||||||||||||||||
|
||||||||||||||||||||||||||
|
Programming assets |
1,211.9 |
1,201.6 |
||||||||||||||||||||||||
|
Equity |
753.9 |
584.1 |
||||||||||||||||||||||||
|
Equity ratio (in %) |
19.3 |
16.4 |
||||||||||||||||||||||||
|
Cash and cash equivalents |
470.6 |
395.7 |
||||||||||||||||||||||||
|
Financial liabilities |
1,973.1 |
1,842.0 |
||||||||||||||||||||||||
|
Leverage6 |
1.810 |
1.88 |
||||||||||||||||||||||||
|
Net financial debt |
1,502.5 |
1,446.39 |
||||||||||||||||||||||||
|
Employees7 |
4,210 |
3,590 |
||||||||||||||||||||||||