
Video-on-demand
Vertical
EBITDA
IPTV
High definition (HD)
Business Development of the Segments
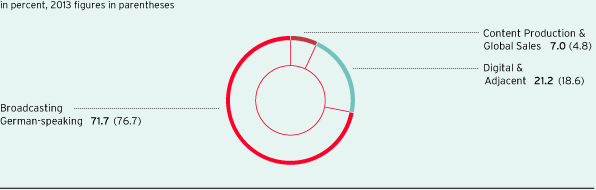
Group revenue share by segment

Broadcasting German-speaking Segment
In the 2014 financial year, external revenues in the Broadcasting German-speaking segment grew to EUR 2.063 billion. This is an increase of 3.2 % or EUR 64.9 million. The positive revenue performance is based on higher TV advertising revenues. In view of a stable economic and sector environment, advertising revenues increased in Germany as well as in Switzerland and Austria. The Group also significantly increased its revenues from the distribution of its stations in HD quality. Here, ProSiebenSat.1 participates in technical service fees that end customers pay to cable, satellite and IPTV providers.
The ProSiebenSat.1 Group invests consistently in the development of its TV portfolio and the programming of its stations. As a result, costs increased in proportion with revenues. Nonetheless, recurring EBITDA adjusted for one-off effects improved by 3.6 % to EUR 702.8 million (previous year: EUR 678.6 million). The corresponding recurring EBITDA margin amounted to 32.9 % (previous year: 32.7 %) and reflected the high level of profitability of the TV business. EBITDA showed an increase of 5.7 % to EUR 686.8 million year-on-year due to higher revenues and lower non-recurring effects (previous year: EUR 649.9 million).
|
Key figures Broadcasting German-speaking segment |
||||||
|
|
|
|
||||
|
EUR m |
2014 |
2013 |
||||
|
||||||
|
Segment revenues |
2,139.4 |
2,074.4 |
||||
|
External revenues |
2,062.7 |
1,997.8 |
||||
|
Internal revenues |
76.6 |
76.6 |
||||
|
EBITDA |
686.8 |
649.9 |
||||
|
Recurring EBITDA |
702.8 |
678.6 |
||||
|
Recurring EBITDA margin1 (in %) |
32.9 |
32.7 |
||||
Digital & Adjacent Segment
The Digital & Adjacent segment also continued its profitable growth in 2014. The external revenues continued to increase from a high level, reaching EUR 610.7 million. This equates to an increase of 26.3 % or EUR 127.0 million compared to 2013. The strongest growth driver was the digital commerce business. The travel vertical in particular continued its dynamic revenue growth. The ProSiebenSat.1 Group’s digital entertainment offerings also showed high organic growth. The online advertising business and the video-on-demand portal maxdome made a significant contribution. Besides organic growth, revenues in the Digital & Adjacent segment also grew due to acquisitions. This was in particular due to the first-time consolidations of the tourism company COMVEL GmbH and Aeria Games Europe GmbH.
Against the backdrop of the revenue development, the recurring EBITDA margin amounted to 21.0 % (previous year: 21.6 %). At the same time the recurring EBITDA also improved significantly despite higher costs. Year-on-year, it climbed by 22.7 % and amounted to EUR 129.3 million (previous year: EUR 105.4 million). EBITDA grew at a similar level to EUR 123.6 million (+22.4 % or +EUR 22.7 million year-on-year).
|
Key figures Digital & Adjacent segment |
||||||
|
|
|
|
||||
|
EUR m |
2014 |
2013 |
||||
|
||||||
|
Segment revenues |
615.3 |
487.2 |
||||
|
External revenues |
610.7 |
483.7 |
||||
|
Internal revenues |
4.5 |
3.5 |
||||
|
EBITDA |
123.6 |
100.9 |
||||
|
Recurring EBITDA |
129.3 |
105.4 |
||||
|
Recurring EBITDA margin1 (in %) |
21.0 |
21.6 |
||||
Content Production & Global Sales Segment
In the Content Production & Global Sales segment, external revenues increased by 63.4 % to EUR 202.2 million (previous year: EUR 123.8 million). Revenue growth was largely organic in 2014, with the production business in the USA making the greatest contribution to revenues. In addition to the organic growth, the first-time consolidation of the US production firm Half Yard Productions LLC since March 2014 also had a positive impact. At the same time, the Red Arrow Entertainment Group achieved vital sales successes around the world.
Due to the considerable increase in revenues in 2014, operating key earnings figures also grew at high rates: Recurring EBITDA grew by 80.1 % to EUR 19.1 million (previous year: EUR 10.6 million); the recurring EBITDA margin increased due to portfolio optimizations by 1.5 percentage points to 7.8 %. EBITDA was EUR 16.0 million. This equates to growth of 38.9 % or EUR 4.5 million. Costs rose as a result of growth.
|
Key figures Content Production & Global Sales segment |
||||||
|
|
|
|
||||
|
EUR m |
2014 |
2013 |
||||
|
||||||
|
Segment revenues |
244.5 |
167.5 |
||||
|
External revenues |
202.2 |
123.8 |
||||
|
Internal revenues |
42.4 |
43.8 |
||||
|
EBITDA |
16.0 |
11.5 |
||||
|
Recurring EBITDA |
19.1 |
10.6 |
||||
|
Recurring EBITDA margin1 (in %) |
7.8 |
6.3 |
||||